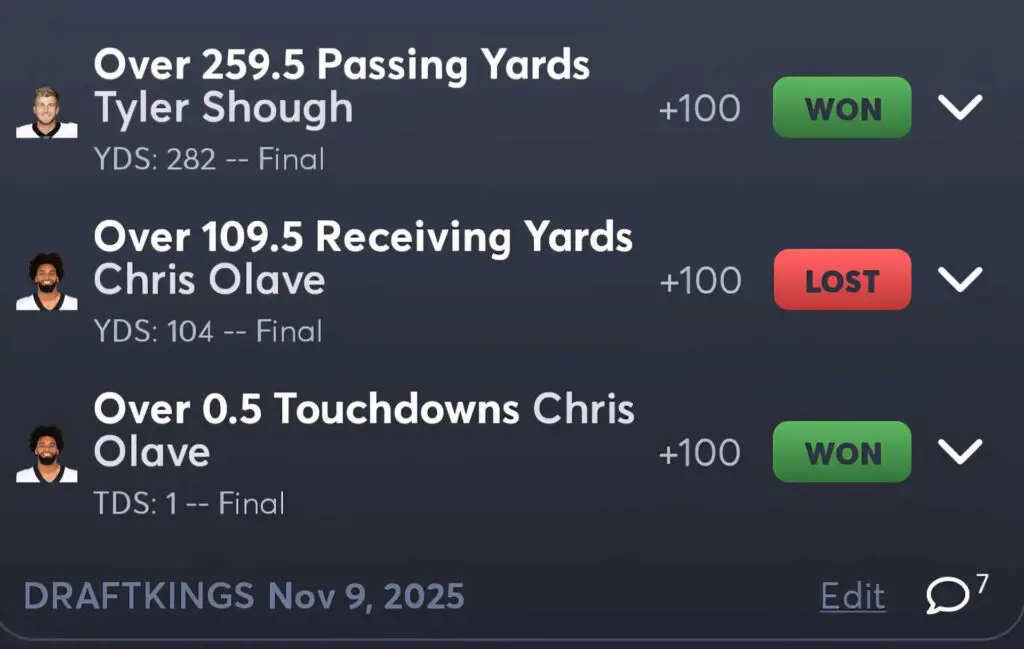
Last week I missed a 35:1 same game parlay by six Chris Olave receiving yards.

Close doesn’t count…unless you ladder.
It was a bet based on the “tail” outcome of (1) Tyler Shough performing more like a good NFL QB than a limited rookie, and (2) Chris Olave maximizing a downfield role following the trade of Rashid Shaheed.
I think there’s a lot of opportunity to find a betting edge on extreme outcomes that sit at the “tails” of the player performance distribution, and I’ve learned a lot on the topic from Judah Fortgang’s insightful writing.
Today, as the Robin Hood of sports betting, taking from the books and giving to the bettors, I’ll show you a key insight I’ve learned about how sportsbooks price extreme player outcomes.
I’ll cover my methods, share an example, and talk about how it can make your betting sharper.
As always, we’ll look for some wins and close with this week’s Bets of the Week!
Let’s get after it.
Identifying Steady Players and Volatile Players
The key question I came to this exercise with was:
How differently will sportsbooks price tail outcomes for players with a similar average result but different levels of volatility?
First, I used ESPN’s “consistency rating” breakdown as a proxy metric to sort players into those that were most and least volatile.
Focusing on wide receivers, players like Amon-Ra St. Brown, CeeDee Lamb and DeVonta Smith produced a narrower range of yardage outcomes, whereas players like Drake London, George Pickens and A.J. Brown were more volatile.
This makes sense, as the first group produces yards based on a higher volume of catches, whereas the second group delivers more explosive plays.
Next, I looked for pairs of receivers, one stable and one volatile, that had matching yardage over-under lines this week, so I could compare their “tail” pricing.
I found two great pairs to use (volatile player in bold):
Grouping 1: Amon-Ra St. Brown @ 76.5 yards & Drake London @ 76.5 yards
Grouping 2: A.J. Brown @ 58.5 yards & DeVonta Smith @ 57.5 yards
Let’s see if the bolded players are priced as more likely to have huge games (or terrible games) than the others.
Tail Outcome Pricing
I looked at the best available line on each player named above to achieve the following milestones this week: (1) 30+ receiving yards, (2) 100+ receiving yards, (3) 150+ receiving yards.
Based on my research above, I expect the payouts to be comparatively worse (implying a more likely outcome) on the bolded players having huge games.
We must compare the specific groupings, Amon-Ra vs Drake, and AJ Brown vs DeVonta, because they have matching average lines.
Here’s what I found (more likely outcome highlighted):
Player | 30+ Yards | 100+ Yards | 150+ Yards |
|---|---|---|---|
Amon-Ra St. Brown | -1450 | +230 | +1260 |
Drake London | -675 | +198 | +900 |
Grouping 1 showed exactly what I expected. Amon-Ra is almost twice as likely to get to 30 yards, but he is less likely to hit 100 yards, and much less likely to break 150.
Player | 30+ Yards | 100+ Yards | 150+ Yards |
|---|---|---|---|
A.J. Brown | -603 | +375 | +1396 |
DeVonta Smith | -553 | +527 | +3000 |
Grouping 2 was interesting! A.J. Brown was more likely to reach all three milestones, which makes sense in the “tail” outcomes of 100+ and 150+, but is unusual in the “floor” outcome of 30+ yards.
Now that we’ve confirmed sportsbooks incorporate volatility into their pricing, let’s consider how to factor this into our betting.
Betting Tails Well
Here’s what we’ve learned:
Main yardage lines (like Amon-Ra at 76.5) are the book’s guess at the average or mean outcome.
Two players can share that mean and have very different game logs, leading to “fatter tails” or more volatility.
If two WRs have the same 76.5 main line but one guy’s 125+ is +450 and the other is +750, the book is telling you: We think the first guy’s distribution is way spikier.
How might you apply this:
First, compare alt prices for similar main lines across players. Notice when a player’s reputation (e.g. “steady possession guy”) doesn’t match how aggressively books price his tails. A mismatch in either direction may be a betting opportunity.
Next, look up the last 2-3 seasons for a player.
Count how many times they hit the following yardage milestones:
50+, 75+, 100+, 125+.
Turn that into directional probabilities:
He hits 100+ ~1-in-3, or he hits 150+ once per season (5-6% of the time).
Compare that to the implied odds on the book:
If a player has hit 100+ in 30% of his last 30 games, and the book prices 100+ at +700 (implied ~12.5%), something is off.
You’ll still need to consider unique game factors, your bankroll size and risk tolerance in formulating a bet, but this method is a great way to find spiky players to use in SGPs or ladders, and steady players to use in lower-risk wagers.