


Mikael Backlund
CGY · C
SAP Center at San Jose · San Jose

San Jose Sharks
(10-11)
Compare Calgary Flames vs San Jose Sharks last team to score odds across sportsbooks for Tue, Nov 17 at 10:00 PM EST.
Last Team To Score
1st Period 3-Way Last Team To Score
2nd Period 3-Way Last Team To Score
3rd Period 3-Way Last Team To Score
3-Way Last Team To Score
| Team | W | L | OTL | PTS |
|---|---|---|---|---|
 Edmonton Oilers | 16 | 3 | 3 | 35 |
 Vegas Golden Knights | 13 | 6 | 3 | 29 |
 Anaheim Ducks | 11 | 9 | 1 | 23 |
| San Jose Sharks | 10 | 11 | 2 | 22 |
 Seattle Kraken | 9 | 8 | 1 | 19 |
| Calgary Flames | 9 | 11 | 1 | 19 |
 Los Angeles Kings | 5 | 11 | 2 | 12 |
 Vancouver Canucks | 5 | 17 | 1 | 11 |
CGY · C
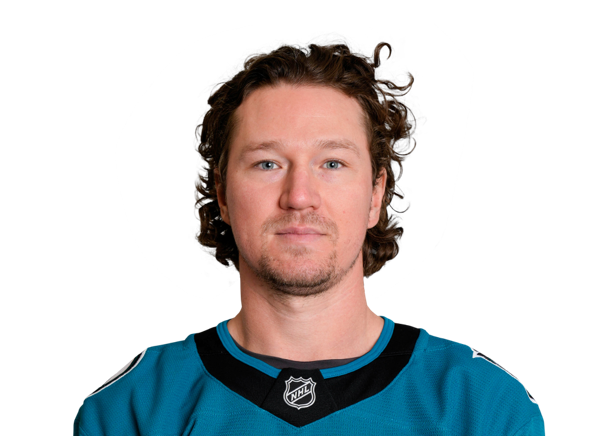
SJS · C
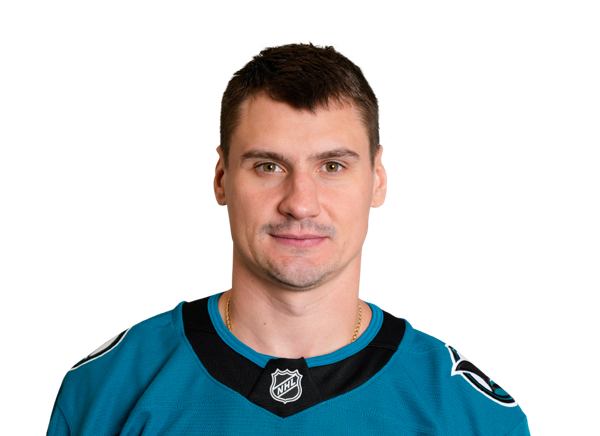
SJS · D
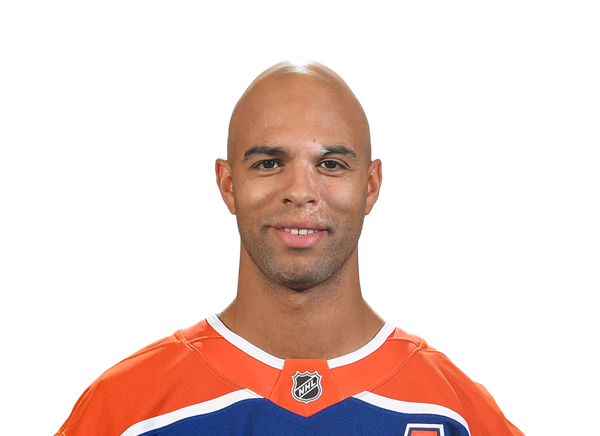
SJS · D

SJS · D

SJS · C
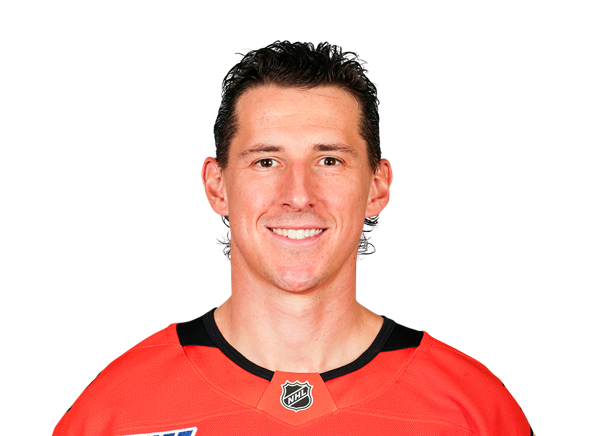
CGY · C
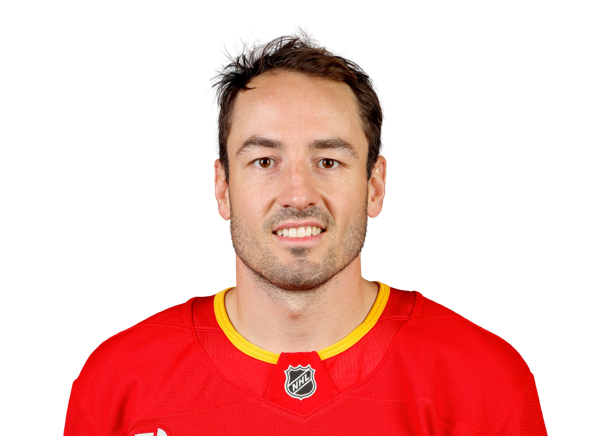
CGY · D

SJS · LW
| Market | Season avg | Line | Consensus odds |
|---|---|---|---|
| Assists | 0.24 | 0.5 | +210 |
| Blocks | 0.52 | — | — |
| Goals | 0.32 | 0.5 | +258 |
| Hits | 1.24 | — | — |
| Points | 0.56 | 0.5 | -104 |
| Shots | 1.88 | 1.5 | -165 |
| Faceoffs Won | 0.12 | — | — |
| Minutes Played | 16.4 | — | — |
| Penalty Minutes | 0.88 | — | — |
| Faceoffs Lost | 0.56 | — | — |
| Plus Minus | -0.28 | — | — |
| First Goal Scorer | 0.16 | — | — |
| Power Play Points | 0.12 | — | — |
| Face Off Percentage | 10 | — | — |

CGY · D
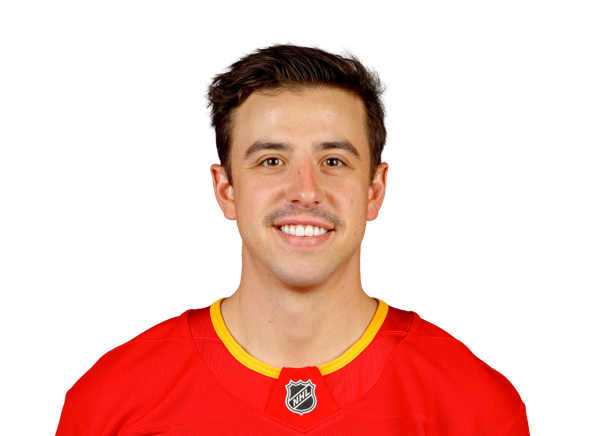
CGY · C
| Market | Season avg | Line | Consensus odds |
|---|---|---|---|
| Assists | 0.39 | 0.5 | +185 |
| Blocks | 0.57 | — | — |
| Goals | 0.22 | 0.5 | +270 |
| Hits | 0.57 | 0.5 | -122 |
| Points | 0.61 | 0.5 | -102 |
| Shots | 1.48 | 1.5 | -120 |
| Faceoffs Won | 5.74 | — | — |
| Minutes Played | 15.3 | — | — |
| Power Play Goals | 0.13 | — | — |
| Penalty Minutes | 0.43 | — | — |
| Faceoffs Lost | 6.39 | — | — |
| Plus Minus | -0.35 | — | — |
| First Goal Scorer | 0.09 | — | — |
| Power Play Points | 0.26 | — | — |
| Face Off Percentage | 48 | — | — |

SJS · RW

CGY · D
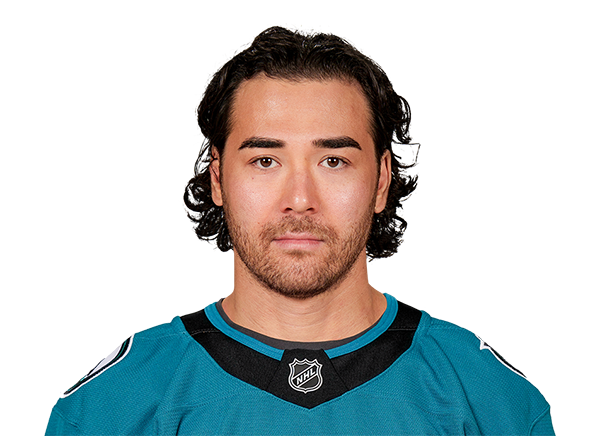
SJS · LW

CGY · LW
| Market | Season avg | Line | Consensus odds |
|---|---|---|---|
| Assists | 0.57 | 0.5 | +155 |
| Blocks | 1 | — | — |
| Goals | 0.35 | 0.5 | +203 |
| Hits | 0.39 | — | — |
| Points | 0.91 | 0.5 | -139 |
| Shots | 2.57 | 2.5 | +109 |
| Faceoffs Won | 0.52 | — | — |
| Minutes Played | 18.8 | — | — |
| Power Play Goals | 0.13 | — | — |
| Short Handed Goals | 0.04 | — | — |
| Penalty Minutes | 0.35 | — | — |
| Faceoffs Lost | 0.7 | — | — |
| Plus Minus | -0.3 | — | — |
| First Goal Scorer | 0.09 | — | — |
| Power Play Points | 0.48 | — | — |
| Face Off Percentage | 25 | — | — |
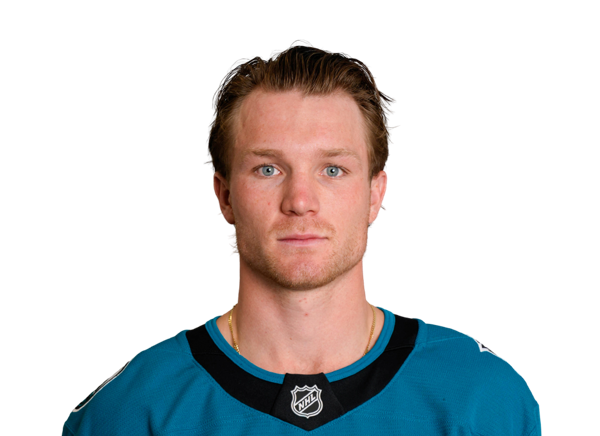
SJS · C

CGY · C
| Market | Season avg | Line | Consensus odds |
|---|---|---|---|
| Assists | 0.26 | 0.5 | +265 |
| Blocks | 0.39 | — | — |
| Goals | 0.17 | 0.5 | +374 |
| Hits | 0.35 | — | — |
| Points | 0.43 | 0.5 | +149 |
| Shots | 1.39 | 1.5 | -127 |
| Faceoffs Won | 0.48 | — | — |
| Minutes Played | 16 | — | — |
| Penalty Minutes | 0.09 | — | — |
| Faceoffs Lost | 0.39 | — | — |
| Plus Minus | -0.3 | — | — |
| First Goal Scorer | 0.04 | — | — |
| Power Play Points | 0.04 | — | — |
| Face Off Percentage | 27.5 | — | — |

CGY · C

SJS · DS

CGY · D

CGY · LW
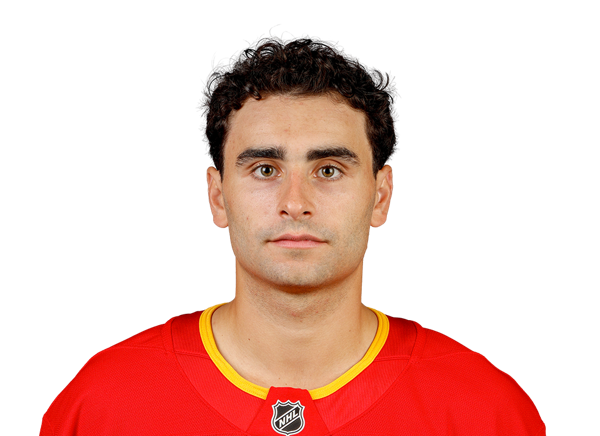
CGY · RW
| Market | Season avg | Line | Consensus odds |
|---|---|---|---|
| Assists | 0.48 | 0.5 | +132 |
| Blocks | 0.35 | — | — |
| Goals | 0.26 | 0.5 | +230 |
| Points | 0.74 | 0.5 | -147 |
| Shots | 2.17 | 2.5 | -125 |
| Faceoffs Won | 2.04 | — | — |
| Minutes Played | 17.4 | — | — |
| Power Play Goals | 0.13 | — | — |
| Penalty Minutes | 0.57 | — | — |
| Faceoffs Lost | 1.7 | — | — |
| Plus Minus | -0.48 | — | — |
| First Goal Scorer | 0.04 | — | — |
| Power Play Points | 0.35 | — | — |
| Face Off Percentage | 50.5 | — | — |

SJS · C

CGY · LW

CGY · RW
| Market | Season avg | Line | Consensus odds |
|---|---|---|---|
| Assists | 0.13 | 1.5 | — |
| Blocks | 0.39 | — | — |
| Goals | 0.17 | 0.5 | +520 |
| Hits | 3.61 | 3.5 | -115 |
| Points | 0.3 | 0.5 | +195 |
| Shots | 1.61 | 1.5 | -110 |
| Faceoffs Won | 0.35 | — | — |
| Minutes Played | 12.1 | — | — |
| Power Play Goals | 0.04 | — | — |
| Penalty Minutes | 1.87 | — | — |
| Faceoffs Lost | 0.74 | — | — |
| Plus Minus | -0.35 | — | — |
| First Goal Scorer | 0.09 | — | — |
| Power Play Points | 0.09 | — | — |
| Face Off Percentage | 17.4 | — | — |

CGY · DS

SJS · C
| Market | Season avg | Line | Consensus odds |
|---|---|---|---|
| Assists | 0.48 | 0.5 | +115 |
| Blocks | 0.2 | — | — |
| Goals | 0.32 | 0.5 | +190 |
| Hits | 0.36 | — | — |
| Points | 0.8 | 0.5 | -180 |
| Shots | 2.44 | 2.5 | -111 |
| Faceoffs Won | 0.92 | — | — |
| Minutes Played | 19.4 | — | — |
| Power Play Goals | 0.12 | — | — |
| Short Handed Goals | 0.04 | — | — |
| Penalty Minutes | 0.32 | — | — |
| Faceoffs Lost | 0.96 | — | — |
| Plus Minus | -0.16 | — | — |
| First Goal Scorer | 0.04 | — | — |
| Power Play Points | 0.24 | — | — |
| Face Off Percentage | 40.1 | — | — |
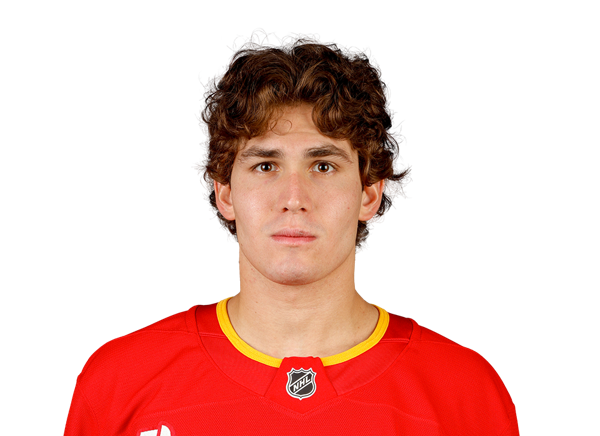
CGY · LW

SJS · RW
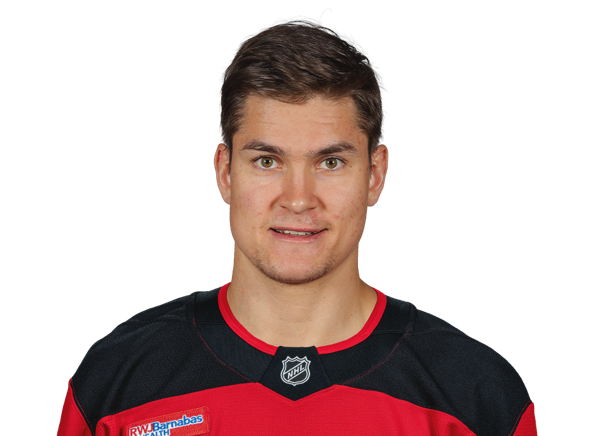
CGY · RW
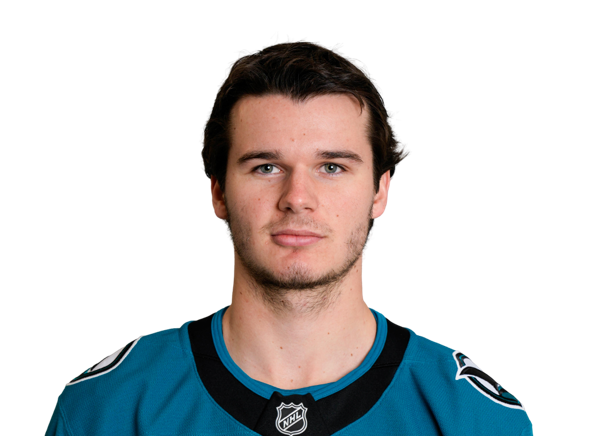
SJS · D
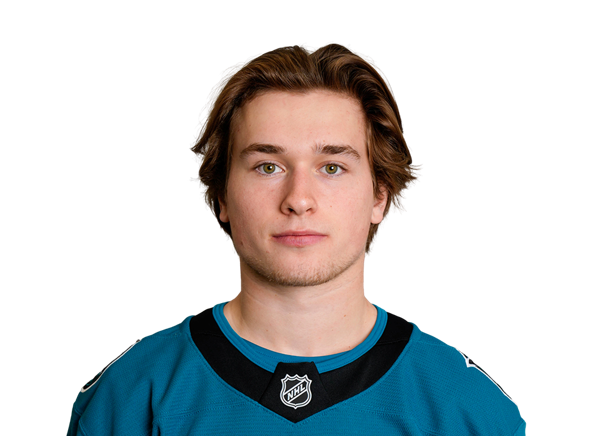
SJS · C
| Market | Season avg | Line | Consensus odds |
|---|---|---|---|
| Assists | 0.87 | 0.5 | -150 |
| Blocks | 0.65 | — | — |
| Goals | 0.43 | 0.5 | +115 |
| Hits | 0.65 | 0.5 | -111 |
| Points | 1.3 | 1.5 | -175 |
| Shots | 3.91 | 3.5 | -162 |
| Faceoffs Won | 8.65 | 8 | -137 |
| Minutes Played | 22.4 | — | — |
| Power Play Goals | 0.13 | — | — |
| Penalty Minutes | 0.87 | — | — |
| Faceoffs Lost | 9.3 | — | — |
| Plus Minus | 0.13 | — | — |
| First Goal Scorer | 0.04 | — | — |
| Power Play Points | 0.48 | — | — |
| Face Off Percentage | 49.4 | — | — |
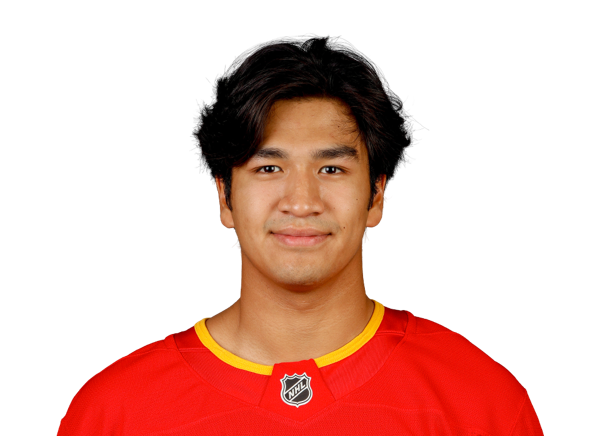
CGY · D
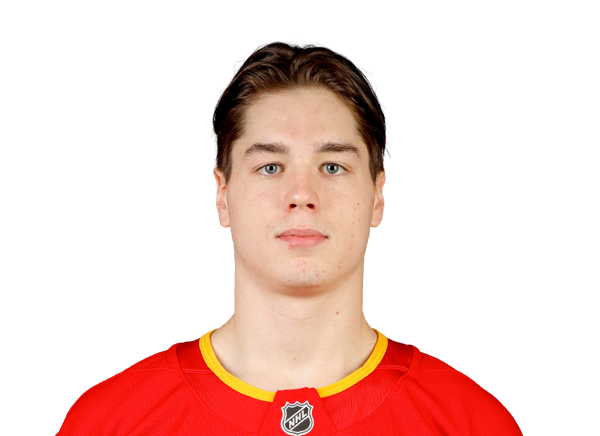
CGY · RW
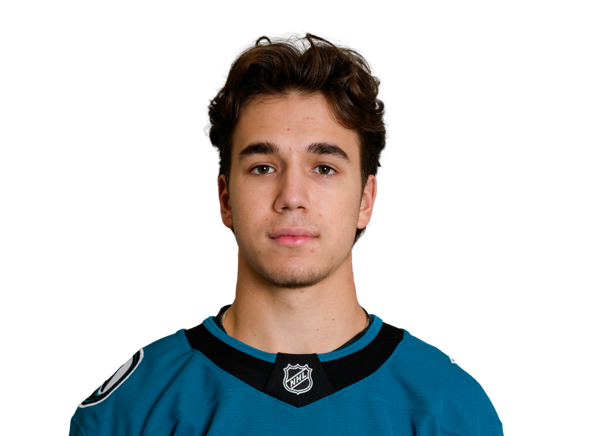
SJS · C
| Market | Season avg | Line | Consensus odds |
|---|---|---|---|
| Assists | 0.38 | 0.5 | +205 |
| Blocks | 0.46 | — | — |
| Goals | 0.27 | 0.5 | +320 |
| Hits | 0.46 | 0.5 | -137 |
| Points | 0.65 | 0.5 | +110 |
| Shots | 1.46 | 1.5 | -110 |
| Faceoffs Won | 4.54 | — | — |
| Minutes Played | 15 | — | — |
| Power Play Goals | 0.08 | — | — |
| Penalty Minutes | 0.31 | — | — |
| Faceoffs Lost | 5.46 | — | — |
| First Goal Scorer | 0.08 | — | — |
| Power Play Points | 0.19 | — | — |
| Face Off Percentage | 44.6 | — | — |

SJS · LW

CGY · C

SJS · D
Get Juice Reel
Download the app